God and RenTech’s Black Box
(Reuters, Jun 24th 2010) Does Renaissance Technologies — arguably the most successful hedge fund in the history of the world — know why it makes as much money as it does? A couple of weeks ago, I thought that it did, after reading a piece about RenTech’s Robert Frey in the FT. One of the fund’s four principles, he said, was rationality – “it can’t just be statistically valid”. You have to employ reason to identify a statistically significant but spurious pattern — which meant, I thought, that RenTech had a common-sense test: it wouldn’t enter into a strategy without having some kind of grip on why that strategy should work.
Ryan Avent, at the Economist, was unconvinced:
According to Sebastian Mallaby’s new hedge fund history, “More Money Than God”, the willingness to explore unexplained correlations is what sets Renaissance apart from other quant funds… The firm’s advantage is in its willingness to trade what doesn’t necessarily make sense…
Mr Frey is obviously in a better position than I am to know whether Renaissance does or does not require some theoretical model to be in place before trading on a signal can begin. But having the guts to trade relationships no one else can understand or explain would be one way to consistently beat the market over a period of two decades.
Scott Locklin, for one, thinks that’s ridiculous. Trading a relationship no one can understand or explain, he says, is “how you lose all your money in two weeks”. True scientists, says Locklin, of the type hired by RenTech, are trained to look for actual rather than spurious correlations, and to be able to tell the difference.
So, who’s right? Sebastian Mallaby would seem to be the best person to ask, here, since he spent a lot of time with RenTech types researching his doorstop of a book. So I asked him, and got this back:
The answer is that it is willing to trade stuff in the absence of intuitive explanations, and that this sets it apart from DE Shaw. But RenTech feels more comfortable when there is an intuitive explanation because that reduces the danger of data fitting errors.
Mallaby even quotes RenTech’s Bob Mercer to that effect in the book (page 302, for those of you following along at home):
“If somebody came with a theory about how the phases of Venus influence markets, we would want a lot of evidence….(But) some signals that make no intuitive sense do indeed work…the signals that we have been trading without interruption for fifteen years make no sense. Otherwise someone else would have found them.”
It’s weird, but if you believe Mallaby and Mercer, it’s true: somehow RenTech discovered a secret formula for making money. Follow the rules it spits out, and you’ll be rich, even though the formula makes no visible sense at all.
Does such a formula really exist? Is it as simple as finding it, keeping it secret, and doing whatever it tells you to do? Does that explain why the Medallion fund continues to do so well, even as RenTech’s other funds seem much more likely to come unstuck? And if such a formula does exist, would there have to be some deep reason why it works, which is just too recondite for mere mortals to work out? We’re entering the realm of the metaphysical here, which might be condign for a book entitled “More Money than God”. Maybe God — and only God — knows why James Simons is so rich, and maybe his formula is the modern-day equivalent of the Holy Grail.
Editing Assistant: Frances Wu
AI That Picks Stocks Better Than the Pros
(Technology MIT Review, June 10 2010) The ability to predict the stock market is, as any Wall Street quantitative trader (or quant) will tell you, a license to print money. So it should be of no small interest to anyone who likes money that a new system that works in a radically different way than previous automated trading schemes appears to be able to beat Wall Street’s best quantitative mutual funds at their own game.
It’s called the Arizona Financial Text system, or AZFinText, and it works by ingesting large quantities of financial news stories (in initial tests, from Yahoo Finance) along with minute-by-minute stock price data, and then using the former to figure out how to predict the latter. Then it buys, or shorts, every stock it believes will move more than 1% of its current price in the next 20 minutes – and it never holds a stock for longer.
The system was developed by Robert P. Schumaker of Iona College in New Rochelle and and Hsinchun Chen of the University of Arizona, and was first described in a paper published early this year. Both researchers continue to experiment with and enhance the system – more on that below.
Using data from five non-consecutive weeks in 2005, a period chosen for its lack of unusual stock market activity, here’s how AZFinText performed versus funds that traded in the same securities (which were all chosen from the S&P 500):
And here’s how it performed compared to the top 10 quantitative mutual funds in the world, all of which draw from a much larger basket of securities, except of course for the included S&P 500 itself:
Software that analyzes textual financial information – quarterly reports, press releases, news articles – is nothing new. Researchers have been publishing on the subject since at least the mid-1990’s.
However, previous approaches to this technique were hampered by either poor performance (averaging little better than chance) and / or requirements for unreasonable amounts of computational horsepower. Schumaker and Chen get around these issues by first radically shrinking the amount of text their system has to parse by boiling down all the financial articles the system ingests into words falling into specific categories of information.
Interestingly, these techniques and categories derive from classification schemes described at the 7th Message Understanding Conference, held in 1997, which was a Defense Advanced Research Projects Agency project to create new and better ways to extract information and meaning from texts. (At the time, they were concentrating on terrorist activities in Latin America, airplane crashes, rocket and missile launches and other things relevant to national security.)
Schumaker and Chen’s system concentrates on Proper Nouns – people and companies – and combines information about their frequency with stock prices at the moment a news article is released. Using a machine learning algorithm on historical data, they look for correlations that can be used to predict future stock prices.
Further work with the AZFinText system has revealed oddities that may or may not remain relevant as researchers continue to apply it to other bodies of historical stock market and financial news data. For example, in a paper described on June 6 at the Computational Linguistics in a World of Social Media workshop, Schumaker went fishing for the Verbs most likely to cause a stock to move up or down in the next 20 minutes, and came up with a list of 211 terms that had some power to move stock prices. (In his work, ‘verb’ is a technical term, and does not exactly correspond with the conventional definition of the word.)According to Schumaker:
The five verbs with highest negative impact on stock price are hereto, comparable, charge, summit and green. If the verb hereto were to appear in a financial article, AZFinText would discount the price by $0.0029. While this movement may not appear to be much, the continued usage of negative verbs is additive.
The five verbs with the highest positive impact on stock prices are planted, announcing, front, smaller and crude.
Schumaker did not attempt to determine why these particular terms move stock prices, but it’s interesting to note that the stock market does not appear to like the marketing buzzword “green,” but is quite happy to hear any news at all about the term “crude,” as in oil.
Editing Assistant: Frances Wu
Up and Down and Round and Round
(Bespoke, June 3, 2010) From February 8th to April 23rd, the S&P 500 climbed 15.9%. From April 23rd through yesterday, the index was down about 10% on a closing basis. As shown in the candle chart below, the mountain has been a lot steeper on the way down than it was on the way up. On the way up, the market basically inched a little bit higher each day in a very tight range, averaging a daily hi-lo spread of 0.99%. On the way down, investors have been thrown off a cliff, with huge moves and an average daily hi-lo spread of 2.47%. After making a steep ascent and then basically falling down, markets now sit right where they did in early February. This is one case where slow and steady did not win the race.
Editing Assistant: Frances Wu
Volatility Concentration Are Bearish?
(Advisor Group, June 4, 2010) A reader commented and asked:
“The article ‘Volatility is a Bear Market Signal’ by David Schwartz measures volatility not in terms simply of big percentage days, but a cluster of such days within a specified time period (movements in excess of 1% on FTSE on at least 20 of 40 consecutive trading days). The prediction made in 2007 looks to have been well founded, giving the strategy an apparent success rate of 8 out of 9 hits if the author’s data can be trusted. What do you think?”
To check this signal independently, we measure returns at intervals of 5, 10, 21, 63, 126 and 252 trading days after onset of concentrations of days with close-to-close volatility greater than 1% for the S&P 500 Index. Using daily closes of the index for January 1950 through May 2010, we find that:
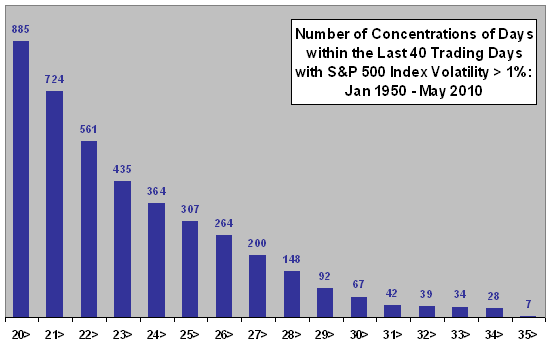
The following chart shows the number of trading days with lagged concentrations of S&P 500 Index daily volatility over the entire sample period. For example, there are 885 instances of intervals of 40 trading days during which at least 20 days have S&P 500 Index movement (up or down) of at least 1%. However, these intervals cluster/overlap, such that a trader tracking this condition and exiting the market upon encountering it would not be able to act on most of the 885 signals.There are no intervals of 40 trading days with 36 high-volatility days.
What are the future returns after tradable signals?
Assumptions for measuring tradable future returns are:
■Exit is at the close with a signal (the trader must slightly anticipate the daily close that reaches the threshold condition).
■For future return intervals of 63 trading days or less, signals must be at least three months apart (frequent traders could relax this assumption for short-term trading).
■For future return intervals of 126 (252) trading days, signals must be at least six months (one year) apart.
■Ignore trading frictions (there are not many trades) and dividends.
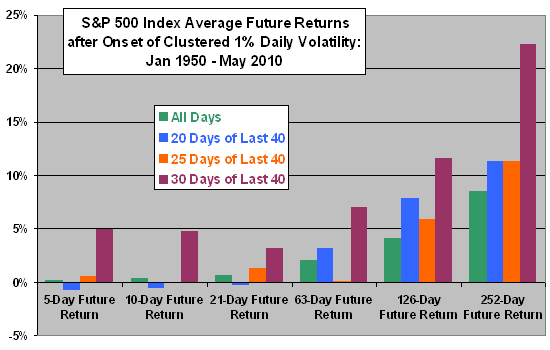
The next chart summarizes S&P 500 Index average future returns at various horizons after onset of clustered daily volatilities of at least 1% (winnowed as described) for cluster thresholds of 20, 25 and 30 trading days out of 40 over the entire sample period. Sample sizes are small, with no more than 28, 10 and 4 trades over 60+ years for thresholds of 20, 25 and 30 trading days out of 40, respectively.Average future returns for all days in the sample provide a benchmark for abnormal behavior.
Results do not confirm a belief that tradable volatility clusters reliably signal poor future returns.
More generally, arguments and charts such as presented in the cited article often explicitly or implicitly assume perfect foresight with regard to exit signal threshold and signal economic value. A real investor has access only to past data and may infer different (or no) thresholds based on these data. Said differently, seeing “patterns” retrospectively is not the same as setting rules that make money in real time. Even if a investor knew what threshold to use in the past, the loss avoidance implied in the article unrealistically assumes getting back into the market at bear market lows.
Also, the number of volatility rule/count/threshold combinations the author tried before settling on >20 out of the last 40 over 1% is unknown. The more combinations considered, the more likely the chosen one impounds data snooping bias (luck). The smaller the sample is, the stronger the bias.
In summary, evidence from simple tests does not support a belief that clusters of daily volatility reliably signal poor future returns.
Editing Assistant: Frances Wu
Highest Intraday VIX Readings
(VIX and More, June 4, 2010) With stocks suffering a minor meltdown as I type this (DJIA 9997), I thought I might use the ongoing European sovereign debt crisis and recent May 21st VIX spike to 48.20 to put the recent VIX spike in the context of the all-time highest intraday VIX readings.
The graphic below captures the six crises which have resulted in VIX spikes above the 40.00 level since 1990. Notably, the 2008 financial crisis stands well above the crowed with an intraday high of 89.53. The other five crises have all seen intraday VIX spikes that have topped out in the 48-50 range, with last month’s spike to 48.20 making the European sovereign debt crisis the 6th highest threat – at least as far as an implied volatility proxy is concerned – in the past 20 years.
If one were to use reconstructed data going back to 1987, the best estimate is that the VIX (actually the VXO) would have hit about 170.
Editing Assistant: Frances Wu
Analyst Recommendations
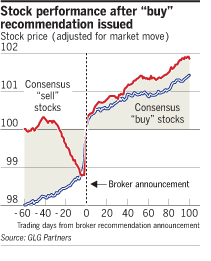
From Financial Times (March 14, 2010) , click for full article
(Financial Times March 14, 2010)…It found that when an average stock burdened with a consensus “sell” recommendation is given a “buy” rating, the underperforming price turns round and, after 100 days, the stock can be expected to outperform the market by about 2 per cent. And when a large broker issues the recommendation, the effect is almost half as much again.
Editing Assisstant: Katherine Xu
Hedge Funds Fail When ‘Rock Stars’ Are in Charge
From Bloomberg and the blog Abnormal Returns,
(Bloomberg) … The ideal hedge fund should be like a good local restaurant: reliable, high-quality, a loyal group of customers, and unknown to the rest of the world.
Editing Assisstant: Katherine Xu
NYT: An Office? She’ll Pass on That
(New York Times) … So, if you can include someone who comes with a different perspective — as long as they embody the same values — it’s a great way to get to the right answer. It helped me to understand that hard work, intelligence and willingness to go the extra mile can come in all shapes, sizes and colors.
… There’s nothing better for sharpening your ability to predict outcomes than living through some period when things went wrong. You learn that events aren’t in your control and no matter how smart you are and how hard you work, you have to anticipate things that can go against you.
… If the person avoids answering the basic questions and instead changes the subject to talk about the work they did, that tells me the person is a bit rigid. Instead of trying to respond to what’s being asked, they’re trying to get an A on the test.
… they have to be able to challenge others and have me challenge them without taking it too personally.
… Investing is all about learning from what you did right and what you did wrong. If you are too afraid to admit what you did wrong, you are setting yourself up to make an even bigger mistake in the future.
Editing Assistant: Lingli Li
For Traders, Big News Is Old News in Minutes
Twitter in particular has contributed to this phenomenon in recent years, some say. On Tuesday, the stock of Darden Restaurants (DRI: 42.02, -0.26, -0.61%) — owner and operator of casual dining restaurants such as Olive Garden and Red Lobster — started to decline. Ryan Detrick, senior technical strategist with Schaeffer’s Investment Research, an options-trading and investor education firm, looked on the newswires to try to find out why. When he didn’t see anything, he turned to Twitter, where he saw that an analyst had downgraded the stock to hold from buy. (Here for full article)
Editing Assistant: Lingli Li
About Tudor’s Quant Funds
Some info on Tudor’s quant funds – hat tip Market Folly:
(Blog.CTNews.com) … Evans, [star trader of Tudor’s quant fund], has been a bit of a mystery, with very little written about his background or how many people he has helping him figure out the proprietary statistical formula that earned him positive 35.5 percent returns in 2008, and allowed him to grow his asset under management to $1.1 billion this year.
… Paul Tudor Jones shows his love for Evans’ trading skills by giving 10 percent of his $7 billion BVI Global Portfolio L.P. to the quant funds (Tudor calls it the “system trading group” – there 18 of them) that Evans helped build for Tudor Investment Corp. Of that $700 million, half of it goes right into the Tensor fund. Talk about commitment — and maybe a little bit of pressure to perform — because that means a third of Evans total AUM comes directly from Tudor Jones flagship fund that he has a ton of his own coin in.
Editing Assistant: Lingli Li
-
Archives
- June 2010 (5)
- March 2010 (15)
- February 2010 (7)
- January 2010 (7)
- December 2009 (12)
- November 2009 (13)
- October 2009 (27)
- September 2009 (20)
- August 2009 (2)
-
Categories
-
RSS
Entries RSS
Comments RSS


You must be logged in to post a comment.